Previous posts on the topic of scraping reddit data from the depressionregiments subreddit:
Reddit Depression Regimens – Topic Modeling
Reddit Depression Regimens – Topic Modeling cont’d
Next we will create some plots with javascript. For example, it would be interesting to see how often specific psychotropic medications and supplements are mentioned in the text data.
Below is a chart with frequencies of the most common antidepressant medications. The counts were performed by combining the frequencies of the brand name and the chemical name (for example Wellbutrin count is wellbutrin (54) + bupropion (27) = 81).
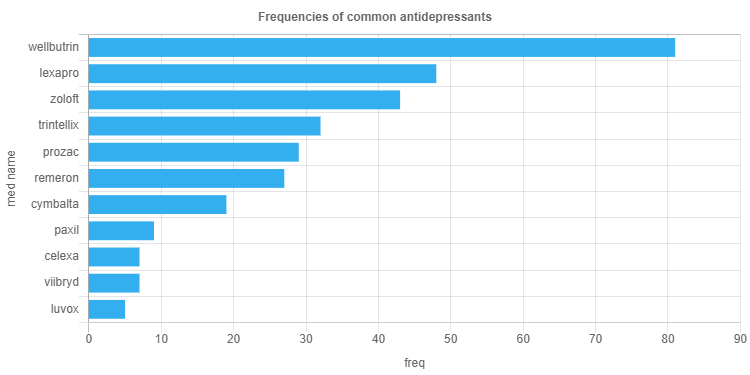
The data was generated using python and exported as a .csv file, with columns ‘term’ and ‘freq’.
HTML part:
<html>
<head>
  https://cdn.plot.ly/plotly-2.0.0.min.js
  https://d3js.org/d3.v5.min.js
  https://cdn.jsdelivr.net/npm/chart.js@2.9.3
  http://script1.js
</head>
<body onload="draw()">
chart 1
<div id="jsdiv" style="border:solid 1px red"></div>
chart 2
<canvas id="chart"></canvas>
</body>
JS part:
function makeChart(meds) {
  // meds is an array of objects where each object is something like

  var hist_labels = meds.map(function(d) {
    return d.term;
  });
  var hist_counts = meds.map(function(d) {
    return +d.freq;
  });

  arrayOfObj = hist_labels.map(function(d, i) {
      return {
        label: d,
        data: hist_counts[i] || 0
      };
    });
  sortedArrayOfObj = arrayOfObj.sort(function(a, b) {
      return b.data - a.data;
    });

   newArrayLabel = [];
   newArrayData = [];
   sortedArrayOfObj.forEach(function(d){
      newArrayLabel.push(d.label);
      newArrayData.push(d.data);
    });


  var chart = new Chart('chart', {
    type: "horizontalBar",
    options: {
      maintainAspectRatio: false,
      legend: {
        display: false
      }
    },
    data: {
      labels: newArrayLabel,
      datasets: [
        {
          data: newArrayData,
          backgroundColor: "#33AEEF"
        }]
    },
    options: {
      scales: {
        yAxes: [{
          scaleLabel: {
            display: true,
            labelString: 'med name'
          }
        }],
        xAxes: [{
            scaleLabel: {
                display: true,
                labelString: 'freq'
            }
        }],
      },
      legend: {
          display: false
      },
      title: {
          display: true,
          text: 'Frequencies of common antidepressants'
        }
    }
  });
}

// Request data using D3
d3
  .csv("med_list_counts_df.csv")
  .then(makeChart);
We can generate charts with other medication/supplement lists using the same code. Below is a plot with frequencies of common antipsychotics. As you can see, antipsychotics are not mentioned that frequently as antidepressants, and a lot of names in the input list were not mentioned at all (such as haldol or thorazine), and therefore they do not show up in the chart.

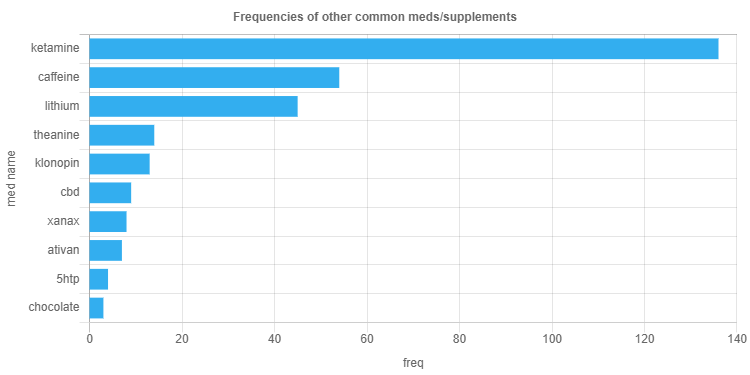
Other medications and common supplements mentioned: